12.2 Point Lights
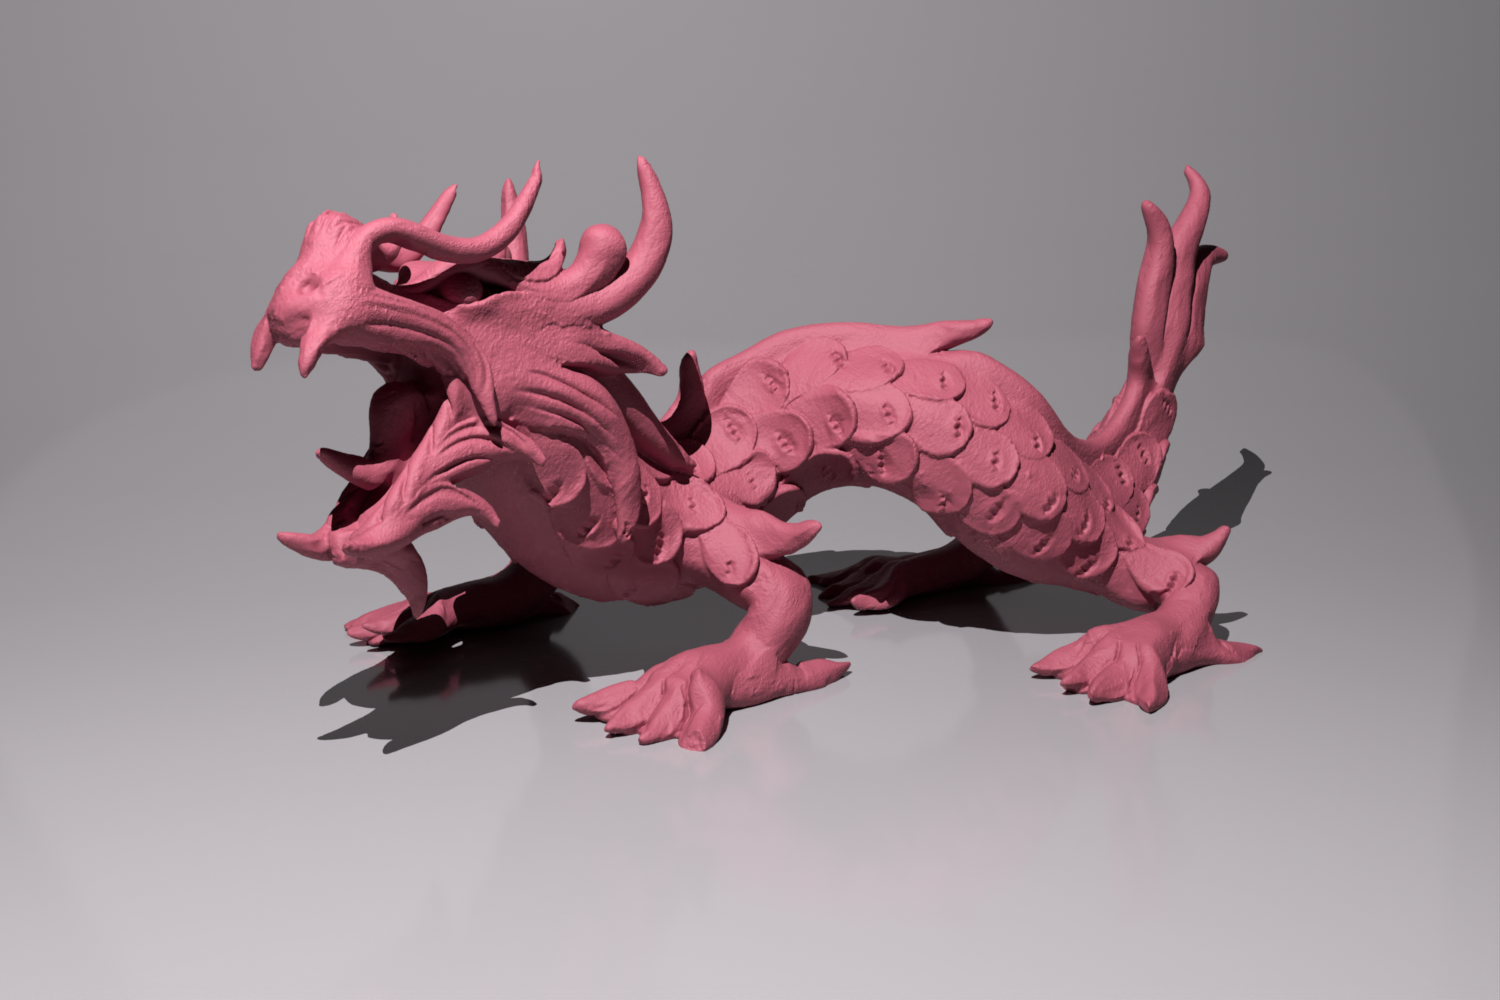
A number of interesting lights can be described in terms of emission from a single point in space with some possibly angularly varying distribution of outgoing light. This section describes the implementation of a number of them, starting with PointLight, which represents an isotropic point light source that emits the same amount of light in all directions. (Figure 12.3 shows a scene rendered with a point light source.) Building on this base, a number of more complex lights based on point sources will then be introduced, including spotlights and a light that projects an image into the scene.

PointLights are positioned at the origin in the light coordinate system. To place them elsewhere, the rendering-from-light transformation should be set accordingly. In addition to passing the common light parameters to LightBase, the constructor supplies LightType::DeltaPosition for its light type, since point lights represent singularities that only emit light from a single position. The constructor also stores the light’s intensity (Section 4.1.1).
As HomogeneousMedium and GridMedium did with spectral scattering coefficients, PointLight uses a DenselySampledSpectrum rather than a Spectrum for the spectral intensity, trading off storage for more efficient spectral sampling operations.
Strictly speaking, it is incorrect to describe the light arriving at a point due to a point light source using units of radiance. Radiant intensity is instead the proper unit for describing emission from a point light source, as explained in Section 4.1. In the light source interfaces here, however, we will abuse terminology and use SampleLi() methods to report the illumination arriving at a point for all types of light sources, dividing radiant intensity by the squared distance to the point to convert units. In the end, the correctness of the computation does not suffer from this fudge, and it makes the implementation of light transport algorithms more straightforward by not requiring them to use different interfaces for different types of lights.
Point lights are described by a delta distribution such that they only illuminate a receiving point from a single direction. Thus, the sampling problem is deterministic and makes no use of the random sample u. We find the light’s position p in the rendering coordinate system and sample its spectral emission at the provided wavelengths. Note that a PDF value of 1 is returned in the LightLiSample: there is implicitly a Dirac delta distribution in both the radiance and the PDF that cancels when the Monte Carlo estimator is evaluated.
Due to the delta distribution, the PointLight::PDF_Li() method returns 0. This value reflects the fact that there is no chance for some other sampling process to randomly generate a direction that would intersect an infinitesimal light source.
The total power emitted by the light source can be found by integrating the intensity over the entire sphere of directions:
Radiant power is returned by the Phi() method and not the luminous power that may have been used to specify the light source.
12.2.1 Spotlights
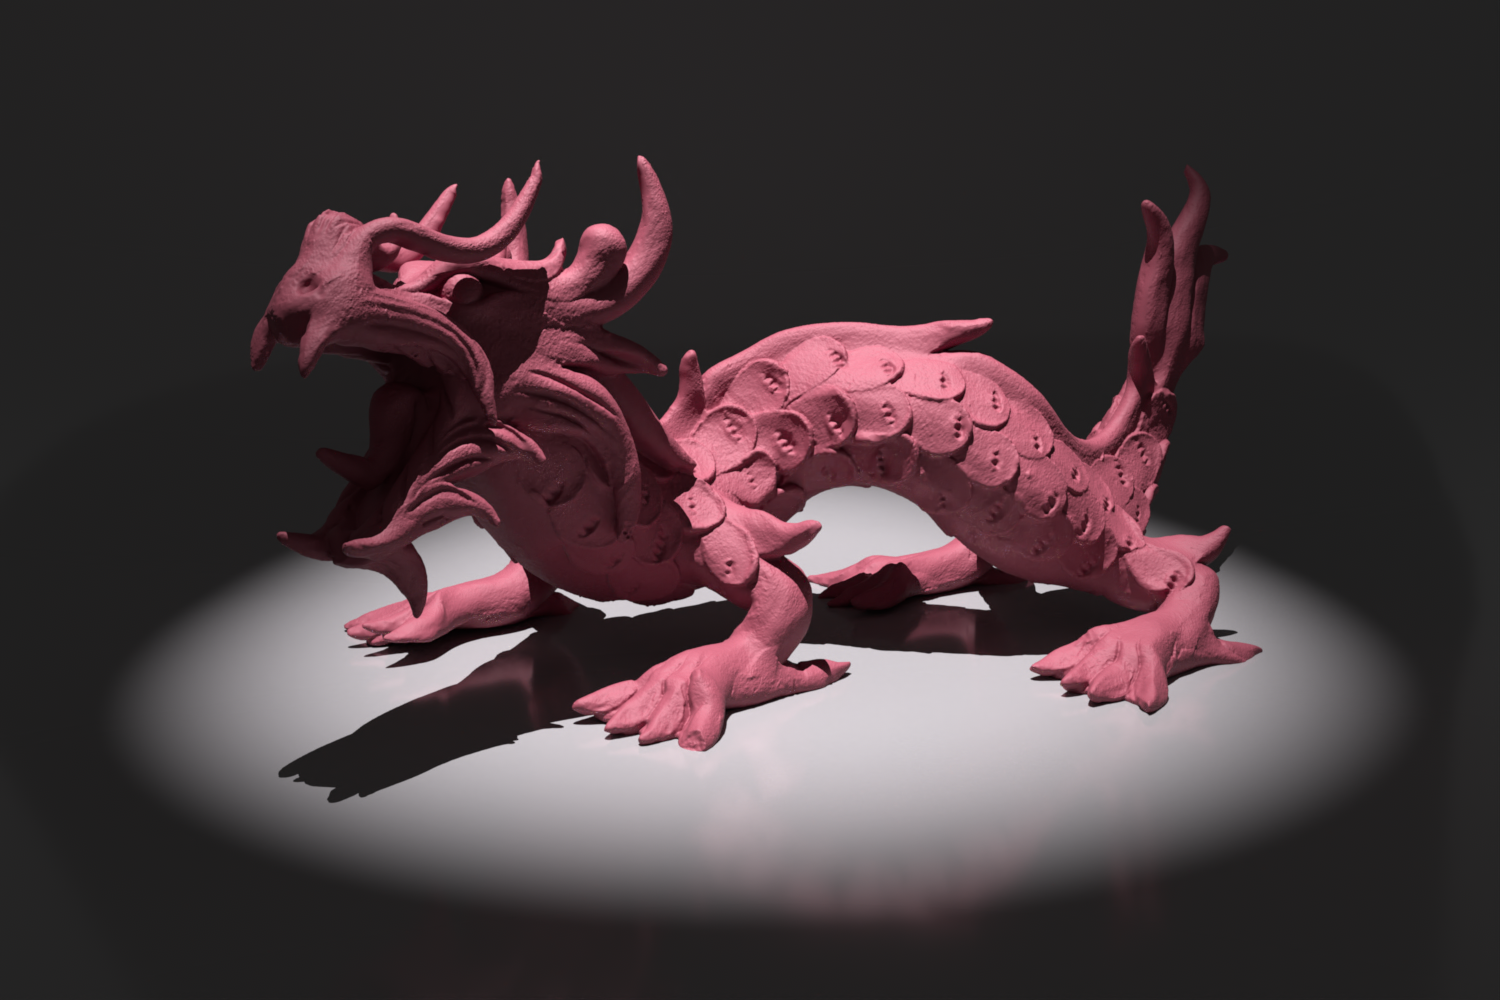
Spotlights are a handy variation on point lights; rather than shining illumination in all directions, they emit light in a cone of directions from their position. For simplicity, we will define the spotlight in the light coordinate system to always be at position and pointing down the axis. To place or orient it elsewhere in the scene, the rendering-from-light transformation should be set accordingly. Figure 12.4 shows a rendering of the same scene as Figure 12.3, illuminated with a spotlight instead of a point light.

There is not anything interesting in the SpotLight constructor, so it is not included here. It is given angles that set the extent of the SpotLight’s cone—the overall angular width of the cone and the angle at which falloff starts (Figure 12.5)—but it stores the cosines of these angles, which are more useful to have at hand in the SpotLight’s methods.
The SpotLight::SampleLi() method is of similar form to that of PointLight::SampleLi(), though an unset sample is returned if the receiving point is outside of the spotlight’s outer cone and thus receives zero radiance.
The I() method computes the distribution of light accounting for the spotlight cone. This computation is encapsulated in a separate method since other SpotLight methods will need to perform it as well.
As with point lights, the SpotLight’s PDF_Li() method always returns zero. It is not included here.
To compute the spotlight’s strength for a direction leaving the light, the first step is to compute the cosine of the angle between that direction and the vector along the center of the spotlight’s cone. Because the spotlight is oriented to point down the axis, the CosTheta() function can be used to do so.
The SmoothStep() function is then used to modulate the emission according to the cosine of the angle: it returns 0 if the provided value is below cosFalloffEnd, 1 if it is above cosFalloffStart, and it interpolates between 0 and 1 for intermediate values using a cubic curve. (To understand its usage, keep in mind that for , as is the case here, if , then .)
To compute the power emitted by a spotlight, it is necessary to integrate the falloff function over the sphere. In spherical coordinates, and are separable, so we just need to integrate over and scale the result by . For the part that lies inside the inner cone of full power, we have
12.2.2 Texture Projection Lights
Another useful light source acts like a slide projector; it takes an image map and projects its image out into the scene. The ProjectionLight class uses a projective transformation to project points in the scene onto the light’s projection plane based on the field of view angle given to the constructor (Figure 12.6).
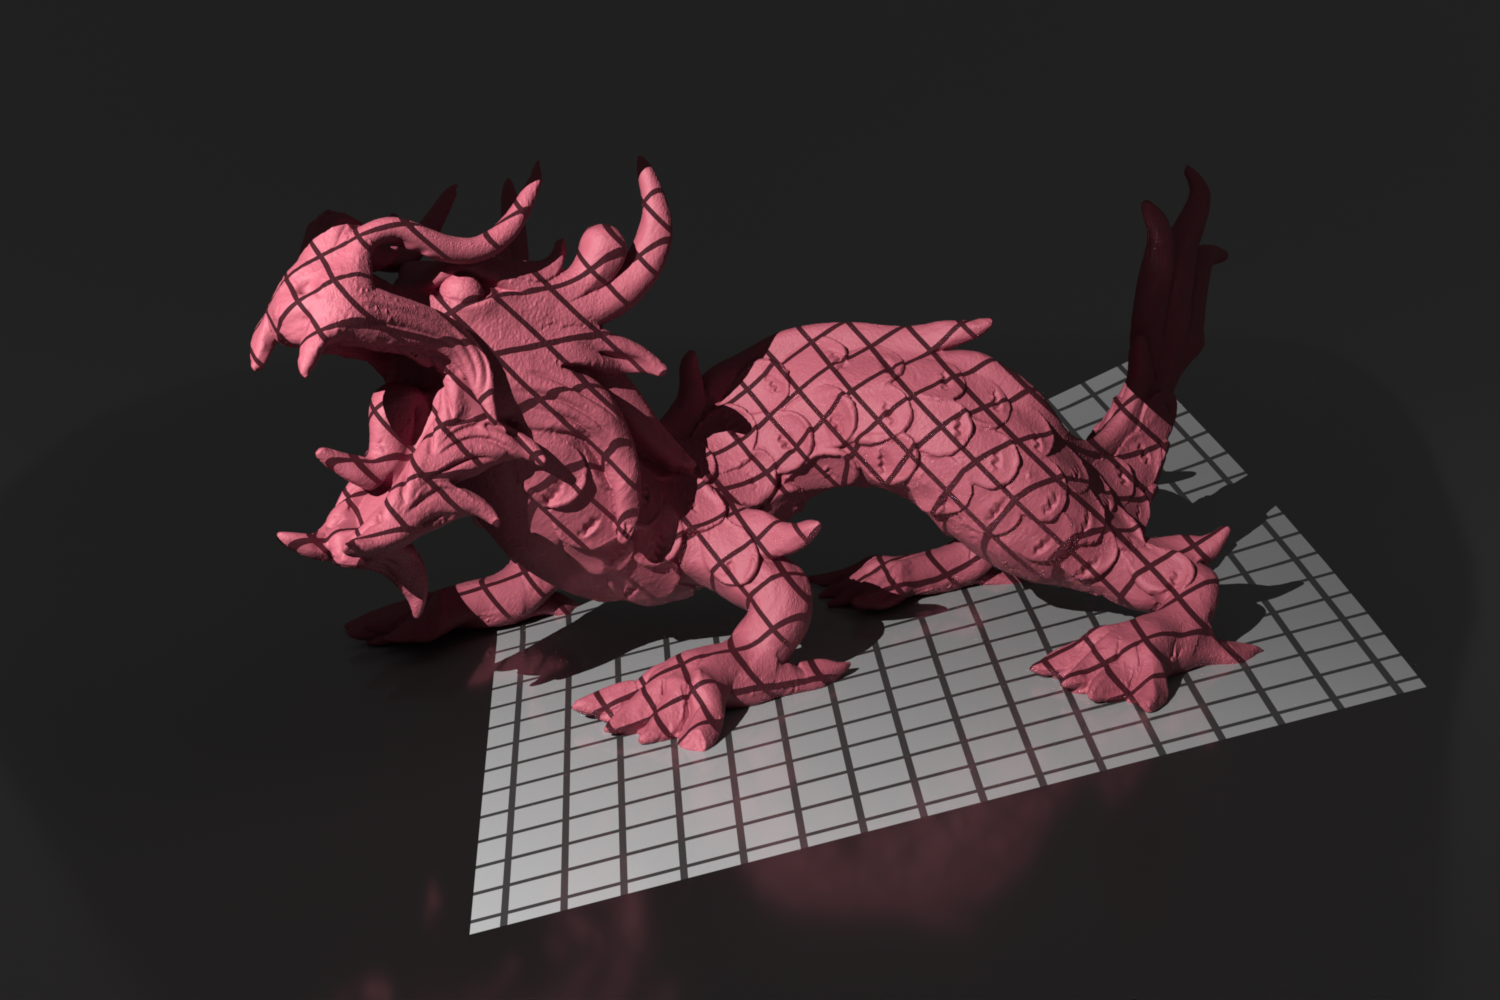
The use of this light in the lighting example scene is shown in Figure 12.7.

This light could use a Texture to represent the light projection distribution so that procedural projection patterns could be used. However, having a tabularized representation of the projection function makes it easier to sample with probability proportional to the projection function. Therefore, the Image class is used to specify the projection pattern.
A color space for the image is stored so that it is possible to convert image RGB values to spectra.
The constructor has more work to do than the ones we have seen so far, including initializing a projection matrix and computing the area of the projected image on the projection plane.
First, similar to the PerspectiveCamera, the ProjectionLight constructor computes a projection matrix and the screen space extent of the projection on the plane.
Since there is no particular need to keep ProjectionLights compact, both of the screen–light transformations are stored explicitly, which makes code in the following that uses them more succinct.
For a number of the following methods, we will need the light-space area of the image on the plane. One way to find this is to compute half of one of the two rectangle edge lengths using the projection’s field of view and to use the fact that the plane is a distance of 1 from the camera’s position. Doubling that gives one edge length and the other can be found using a factor based on the aspect ratio; see Figure 12.8.
The ProjectionLight::SampleLi() follows the same form as SpotLight::SampleLi() except that it uses the following I() method to compute the spectral intensity of the projected image. We will therefore skip over its implementation here. We will also not include the PDF_Li() method’s implementation, as it, too, returns 0.
The direction passed to the I() method should be normalized and already transformed into the light’s coordinate system.
Because the projective transformation has the property that it projects points behind the center of projection to points in front of it, it is important to discard points with a negative value. Therefore, the projection code immediately returns no illumination for projection points that are behind the hither plane for the projection. If this check were not done, then it would not be possible to know if a projected point was originally behind the light (and therefore not illuminated) or in front of it.
After being projected to the projection plane, points with coordinate values outside the screen window are discarded. Points that pass this test are transformed to get texture coordinates inside for the lookup in the image.
One thing to note is that a “nearest” lookup is used rather than, say, bilinear interpolation of the image samples. Although bilinear interpolation would lead to smoother results, especially for low-resolution image maps, in this way the projection function will exactly match the piecewise-constant distribution that is used for importance sampling in the light emission sampling methods. Further, the code here assumes that the image stores red, green, and blue in its first three channels; the code that creates ProjectionLights ensures that this is so.
It is important to use an RGBIlluminantSpectrum to convert the RGB value to spectral samples rather than, say, an RGBUnboundedSpectrum. This ensures that, for example, a RGB value corresponds to the color space’s illuminant and not a constant spectral distribution.
The total emitted power is given by integrating radiant intensity over the sphere of directions (Equation (4.2)), though here the projection function is tabularized over a planar 2D area. Power can thus be computed by integrating over the area of the image and applying a change of variables factor :
Recall from Section 4.2.3 that differential area is converted to differential solid angle by multiplying by a factor and dividing by the squared distance. Because the plane we are integrating over is at , the distance from the origin to a point on the plane is equal to and thus the aggregate factor is ; see Figure 12.9.
For the same reasons as in the Project() method, an RGBIlluminantSpectrum is used to convert each RGB value to spectral samples.
The final integrated value includes a factor of the area that was integrated over, A, and is divided by the total number of pixels.
12.2.3 Goniophotometric Diagram Lights
A goniophotometric diagram describes the angular distribution of luminance from a point light source; it is widely used in illumination engineering to characterize lights. Figure 12.10 shows an example of a goniophotometric diagram in two dimensions. In this section, we will implement a light source that uses goniophotometric diagrams encoded in 2D image maps to describe the emission distribution lights.
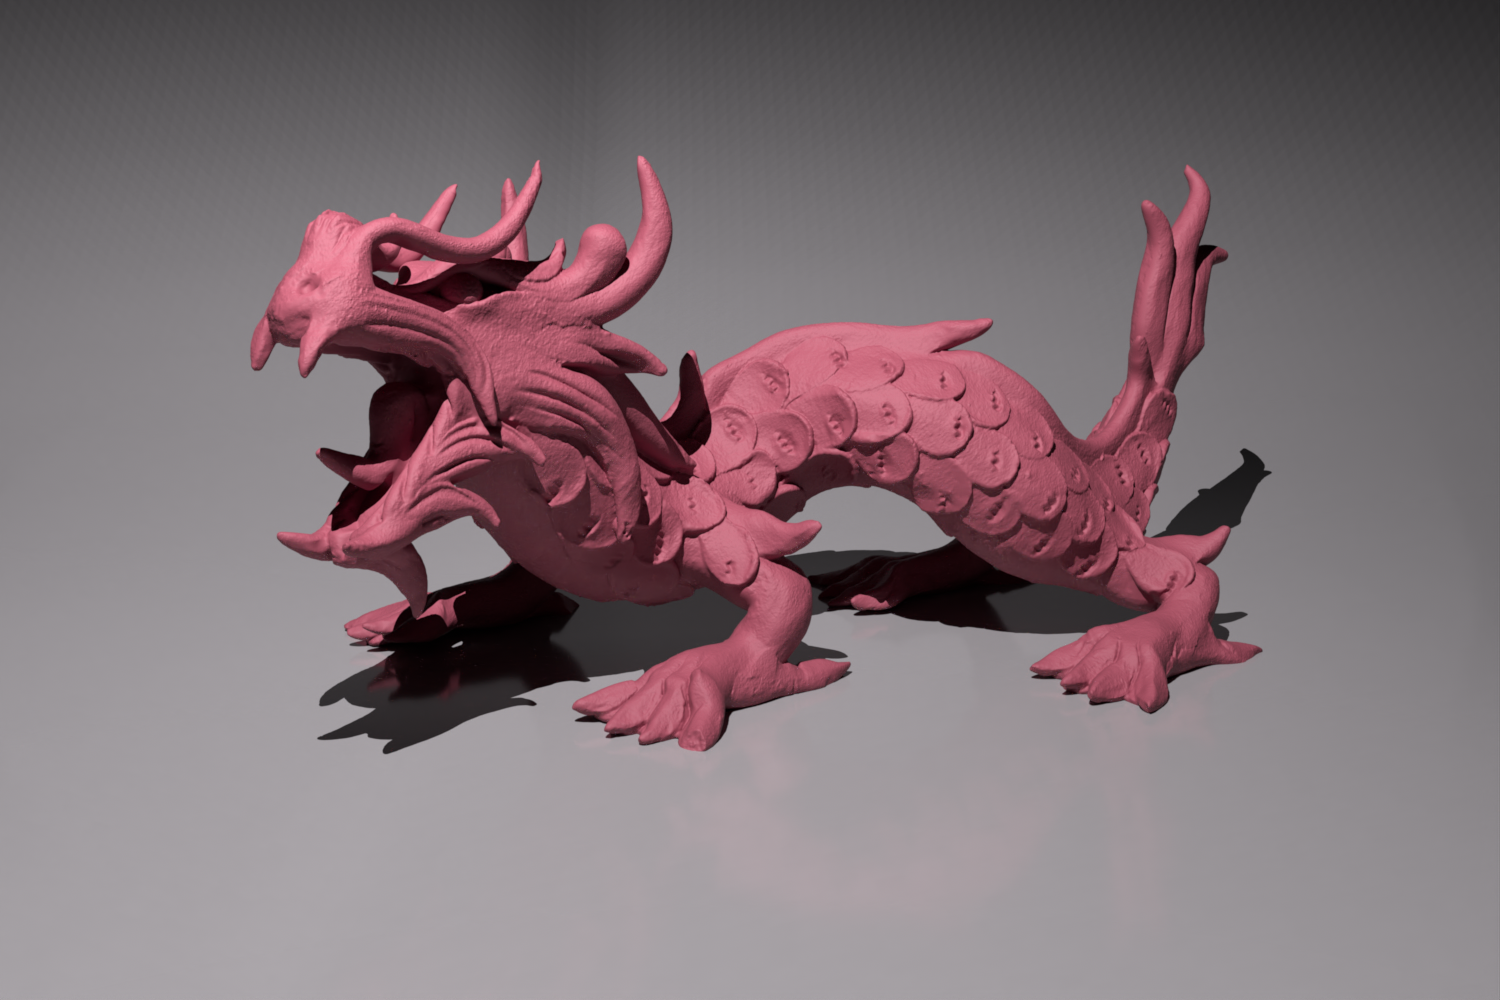
Figure 12.11 shows a few goniophotometric diagrams encoded as image maps and Figure 12.12 shows a scene rendered with a light source that uses one of these images to modulate its directional distribution of illumination. The GoniometricLight uses the equal-area parameterization of the sphere that was introduced in Section 3.8.3, so the center of the image corresponds to the “up” direction.

The GoniometricLight constructor takes a base intensity, an image map that scales the intensity based on the angular distribution of light, and the usual transformation and medium interface; these are stored in the following member variables. In the following methods, only the first channel of the image map will be used to scale the light’s intensity: the GoniometricLight does not support specifying color via the image. It is the responsibility of calling code to convert RGB images to luminance or some other appropriate scalar value before passing the image to the constructor here.
The SampleLi() method follows the same form as that of SpotLight and ProjectionLight, so it is not included here. It uses the following method to compute the radiant intensity for a given direction.
Because it uses an equal-area mapping from the image to the sphere, each pixel in the image subtends an equal solid angle and the change of variables factor for integrating over the sphere of directions is the same for all pixels. Its value is , the ratio of the area of the unit sphere to the unit square.